 wh1le
wh1le



There is nothing quite like the feeling of having a lightbulb moment in the middle of an interview.
Recently, I was asked to calculate machine capacity based on RPS (Requests Per Second) and latency. I’ll admit - I didn’t have the textbook formula memorized. When you spend years in production relying on Datadog dashboards and autoscaling groups, the napkin math fades. It lives in your monitoring tools, not in your head.
But thanks to some great guidance from the interviewer, we worked through the concept, and it highlighted a massive gap between system design theory and Ruby on Rails reality.
The generic math works great for lightweight async languages. But if you try to scale a Rails app purely on textbook formulas, your production environment will crash. Here is a breakdown of how memory limits, Puma threads, the GVL, and PgBouncer completely change the math.
The Textbook Baseline
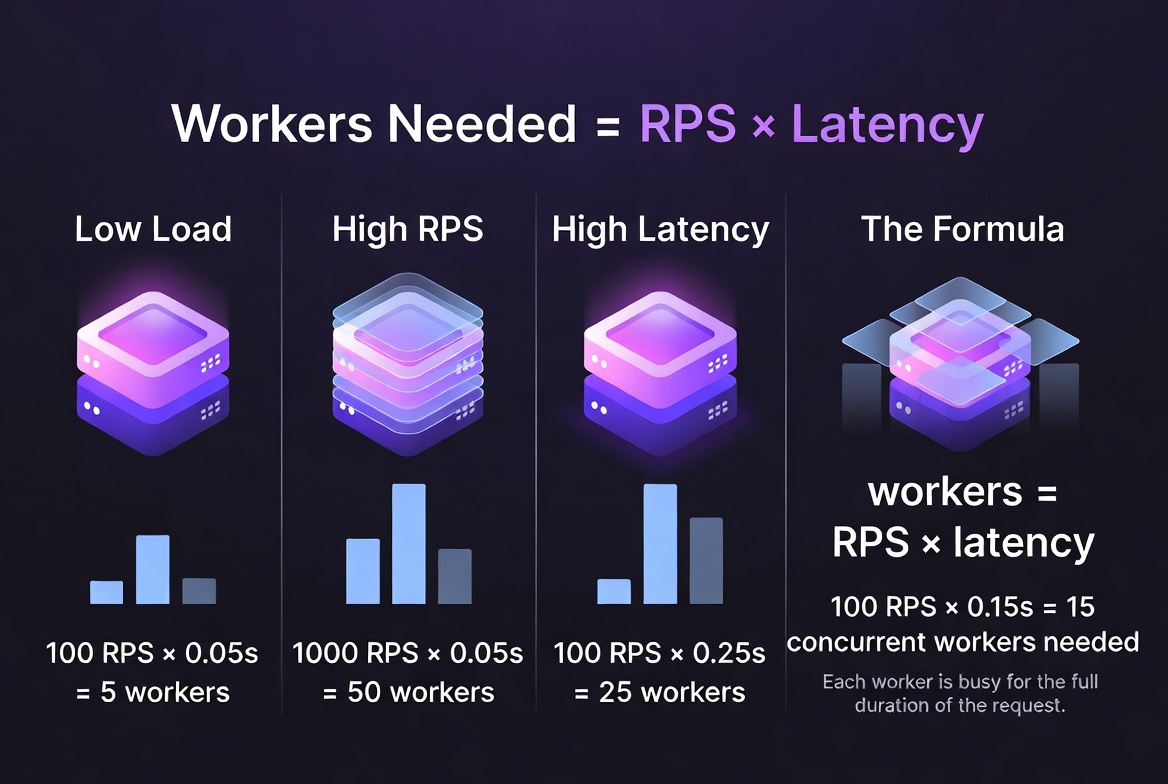
In a standard system design interview, capacity planning boils down to a very clean, simple formula:
workers_needed = requests_per_second × latency_per_request (in seconds)
If your system needs to handle 1,000 requests per second, and your average request takes 200ms (0.2 seconds), the math is straightforward:
1,000 × 0.2 = 200 concurrent workers
In languages like Go or Node.js, spinning up 200 “workers” (coroutines or async tasks) is trivial. A single machine can juggle thousands of Goroutines because they only cost ~2KB of RAM each. You map those 200 workers to a few machines based on CPU cores, and you pass the interview.
But in Rails, “200 workers” is where the trouble starts.
The Rails Reality Check
When you apply the concept of a “worker” to Rails, you hit three distinct walls that textbook system design ignores.
Wall 1: Puma Processes Are Heavy
In the Rails world, a “worker” is a Puma process - a full fork of your application loaded into memory. Every gem, every initializer, every eager-loaded model. A typical production Rails app weighs 300–500MB per process.
Run the CPU-based math on 200 processes:
200 workers × 400MB = 80GB of RAM
That’s five 16GB machines consumed entirely by application memory - before accounting for the OS, Redis clients, temp files, or anything else. In practice, you’ll hit an OOM (Out of Memory) kill long before reaching that target concurrency.
The realistic configuration for a 4-core machine looks like this:
# config/puma.rb
workers ENV.fetch("WEB_CONCURRENCY", 6)   # cores × 1.5
threads_count = ENV.fetch("RAILS_MAX_THREADS", 5)
threads threads_count, threads_count
Six processes, five threads each: 30 concurrent requests per box. That’s the actual number you can sustain without the kernel killing your processes at 3 AM. Memory is almost always the binding constraint in Rails, not CPU. Calculate it first.
Wall 2: The GVL Limits Your Threads
The natural follow-up question: “Why not set threads to 50 per process to save RAM, and call it a day?”
Because of the GVL (Ruby’s Global VM Lock). Only one thread per process can execute Ruby code at any given moment. Threads don’t give you true parallelism in MRI; they give you concurrency during I/O wait times.
When thread A is blocked waiting on Postgres, thread B can execute Ruby. That’s highly valuable, but if you crank your thread count too high, your threads will just sit around fighting for the GVL, burning CPU on context switching.
This same constraint applies to Sidekiq. Setting Sidekiq concurrency to 50 sounds fast on paper. In reality, each thread holds memory, holds a database connection, and fights for the GVL. The sane production default is 10–25 threads, monitored via RSS for memory bloat.
Wall 3: The Database Will Starve
This is where most Rails scaling stories end in an incident.
Every Puma thread and every Sidekiq thread checks out an ActiveRecord database connection from the pool. If your napkin math says you need 200 concurrent threads across your fleet, you suddenly need 200 simultaneous connections to Postgres.
Postgres handles this poorly. Each connection is a server-side process consuming memory. Beyond a few hundred connections, the database spends more time managing connection overhead than executing queries. Soon, you’ll see ActiveRecord::ConnectionTimeoutError flooding your logs while the database server swaps to disk.
PgBouncer is not a nice-to-have at this scale. It’s mandatory infrastructure. PgBouncer sits between your app and Postgres, maintaining a small pool of real DB connections and multiplexing hundreds of application connections onto them transparently.
# config/database.yml
production:
  host: pgbouncer.internal
  pool: <%= ENV.fetch("RAILS_MAX_THREADS", 5) %>
  prepared_statements: false
That prepared_statements: false line is the gotcha that catches everyone on their first PgBouncer deployment. In transaction pooling mode, prepared statements break silently because they are connection-scoped in Postgres.
Connection pool sizing rule of thumb:
pool_size = (db_server_cores × 2) + effective_spindle_count
For a 4-core Postgres server on SSDs (spindle count ≈ zero), you want a pool of ~10 real connections. Counter-intuitive, but more connections mean more lock contention and slower throughput. If your app needs more concurrency, queue at the application layer - don’t bloat the DB pool.
Why the Safety Buffer Matters
The 1.5x multiplier in capacity planning isn’t conservative hand-waving. It’s survival math.
Think of a highway at 100% capacity. Cars are bumper-to-bumper. One driver taps their brakes, and the resulting jam takes hours to clear. At 70% capacity, the same tap is absorbed without anyone noticing.
And critically: use your p90 or p95 latency in the formula, not the average. If 99 requests complete in 50ms but one slow ActiveRecord query takes 5 seconds, the “average” of 100ms looks healthy. But that one request locks up a Puma thread for 100x longer than expected. A handful of those arriving simultaneously, and your entire worker pool is occupied by slow queries while hundreds of fast requests queue behind them.
The Rails Capacity Checklist
Here is the mental model I’ll walk through the next time I’m asked this question:
| Step | What to calculate | Example (1,000 RPS, 200ms p95 latency) |
|---|---|---|
| 1. Concurrent workers | RPS × p95 latency × 1.5 | 1,000 × 0.2 × 1.5 = 300 workers |
| 2. Per-machine capacity | (cores × 1.5) × threads | (4 × 1.5) × 5 = 30 concurrent requests |
| 3. Fleet size | workers ÷ per-machine | 300 ÷ 30 = 10 machines |
| 4. Memory verification | processes × ~400MB < RAM | 6 × 400MB = 2.4GB (fits safely on 8GB RAM) |
| 5. DB connections | total threads across fleet | 10 machines × 30 = 300 → Requires PgBouncer |
| 6. Sidekiq budget | subtract from DB pool | 50 Sidekiq threads = 50 fewer connections for web |
Bridging the Gap
System design books treat scaling like a clean, linear math problem. But maintaining a Rails app in production is a balancing act of memory limits, locked threads, and connection pools.
Forgetting the exact formula in an interview is a minor stumble. But blindly applying generic math to a Rails app is dangerous. Bridging the gap between textbook theory and production reality is what makes a senior engineer.
Further Reading & Resources
- Thundering Herd: The Problem That Kills Ruby Apps at Scale
- Ruby at Scale: Rate Limit Boundary Burst
- Tail latency - Wikipedia
- Official Rails Performance Tuning Guide - Best starting point for Puma configuration and GVL realities.
- Deploying Rails with Puma (Heroku Dev Center) - Excellent deep dive on threads vs workers and database connection math.
- High Performance PostgreSQL for Rails by Andrew Atkinson - The definitive book if you run Postgres with Rails at scale.
- Scaling Rails: Understanding Puma Workers, Threads, and Database Connection Pooling - Very practical calculations similar to your checklist.
- Rails and pgBouncer Notes - One of the clearest explanations of transaction pooling mode and gotchas.
- The Complete Guide to Rails Performance by Nate Berkopec - Still one of the best resources on real-world Rails performance (even if a bit older).